Mapletree has scaled up significantly since inception in 2000 and delivered strong results in the process. We are committed to delivering consistent and high returns from our business and we established a series of six key performance indicators (KPIs) to monitor our progress and performance.
In 2009, we further set in place five-year targets for each of our KPIs and are well on track to achieve them. The KPIs are represented in this section and they further help to align our key stakeholders such as our business units, investors and partners.
- Earnings before interest and tax plus share of profits of associates and joint ventures (EBIT + SOA) – a measure of size of earnings and cashflow and S$426.8m was achieved in FY11/12 (versus our target: S$600m – S$1b)
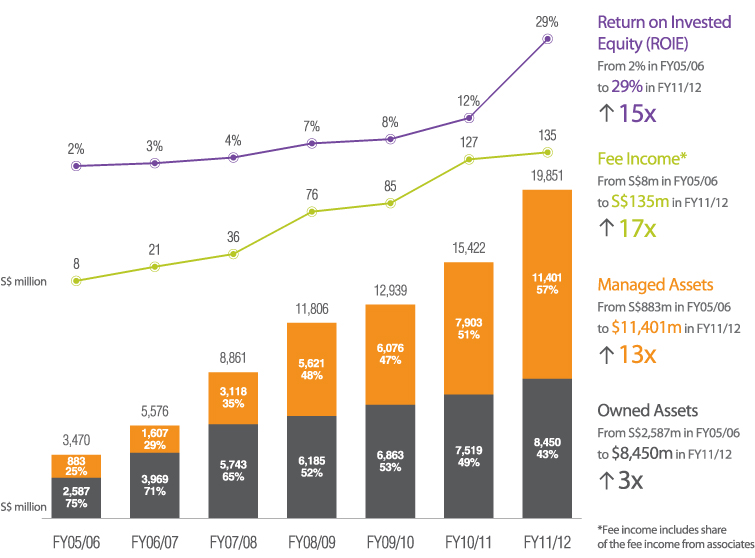
- Fee income – a measure of earnings from capital management business and S$134.3m was achieved in FY11/12 (versus our target: S$200m – S$300m)
- Assets under Management (AUM) – a measure of business scale and S$19.9b was achieved in FY11/12 (versus our target: S$20b – S$25b)
- AUM ratio – proportion of owned versus managed assets, a measure of the use of capital and a ratio of 1.3 : 1 was achieved in FY11/12 (versus our target: 2-3:1)
- Return on invested equity (ROIE) – a measure of return on equity based on historical cash cost to shareholder and 16.5%1 was achieved in FY11/12 (versus our target: 10-15%)
- Net asset value (NAV)2 CAGR – a measure of total returns to shareholders and 12.1% was achieved in FY11/12 (versus our target: 12-15%)
Our Key Performance Figures